
Today’s Model
Today we’re going to build a trading algorithm that utilizes the Moving Average Convergence Divergence indicator to invest in crypto on Coinbase Pro. This is a relatively straightforward algorithm, so let’s get right into it!
Understanding the MACD
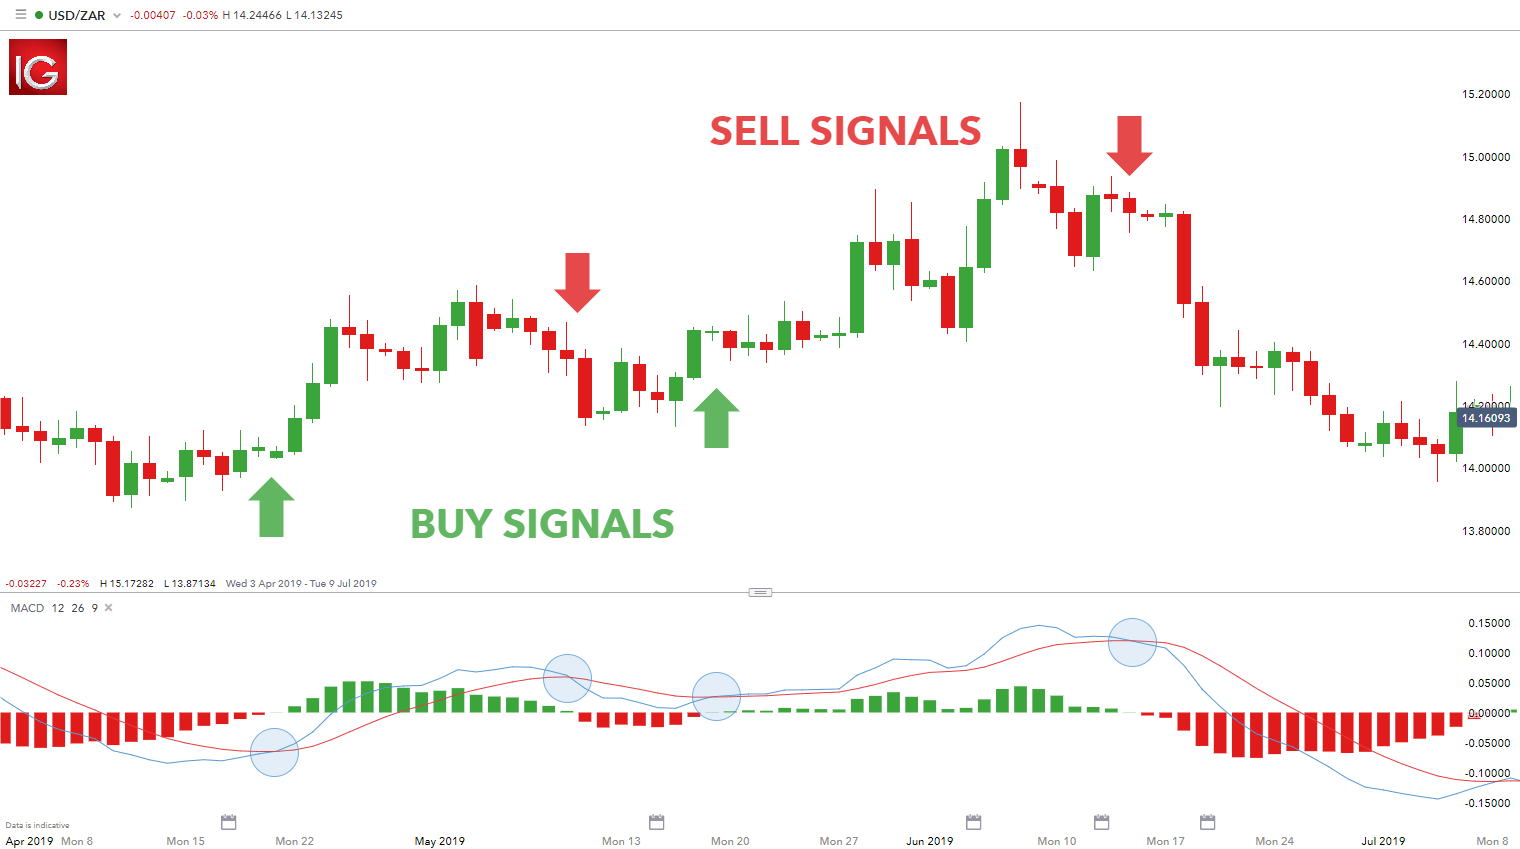
The MACD takes two moving averages at different time frames and essentially provides a signal that looks at the “spread” between the two moving averages. As the two moving averages spread wider (i.e. diverge), then we look to a certain action, when they become equal (i.e. converge), then we look to do a specific action. Thus we can see that the MACD is calculated as the difference between two specific moving averages. The two moving averages that are typically chosen are the 12 and 26 EMA. In addition, a 9-day EMA on the MACD is used as the “signal” to determine when we want to buy or sell (similar to the golden cross). By utilizing this signal, we’re able to detect when we cross up on the signal (for a buy), and when we cross down on the signal (signaling a sell).
Credits: DailyFX
As you can see from this graph above: we are buying when the 9-day EMA hits the MACD line, and selling when it crosses below the 9-day EMA. In addition, the divergence and convergence of the MACD is plotted via the histogram-like plot below. This can help signify how bullish and how bearish a current trend is along with if it might be ending.
Overview
In order to put this into practice, we will first initialize our environment. As we mentioned before, we are running this on Coinbase Pro, so we will need to get all the keys set up in order to move forward and accurately run a backtest.
Here’s the link to how to get your Coinbase Keys, we’ll plug these right into the CLI
Initialize Environment
Initializing without the Blankly Platform
To initialize our environment for Coinbase using blankly all we have to do is install it and run blankly init in our directory.
$ pip install -U blankly
$ blankly init # (Walking through the steps of adding Coinbase Pro Keys)
And awesome! We’ve now initialized our directory with all of our files. To see more information about what’s going on here, you can see more here and here for CLI
Following the prompts, we should now be completely set up!
Initializing with the Blankly Platform
The Blankly Platform enables you to have a wider access of more metrics, visualizations, and features along with the storage of your previous backtests all over time. It also allows you to deploy your model live to production in literally seconds. Now all we have to do is alter our step above and do:
$ pip install -U blankly
$ blankly login # (This will take you to the platform)
$ blankly init
Once you’re logged in, you can finish the set up and creation of your first model via blankly init and selecting “Yes I want to connect to the platform”.
Quick Overview of Directory
Blankly directories are divided into a few parts:
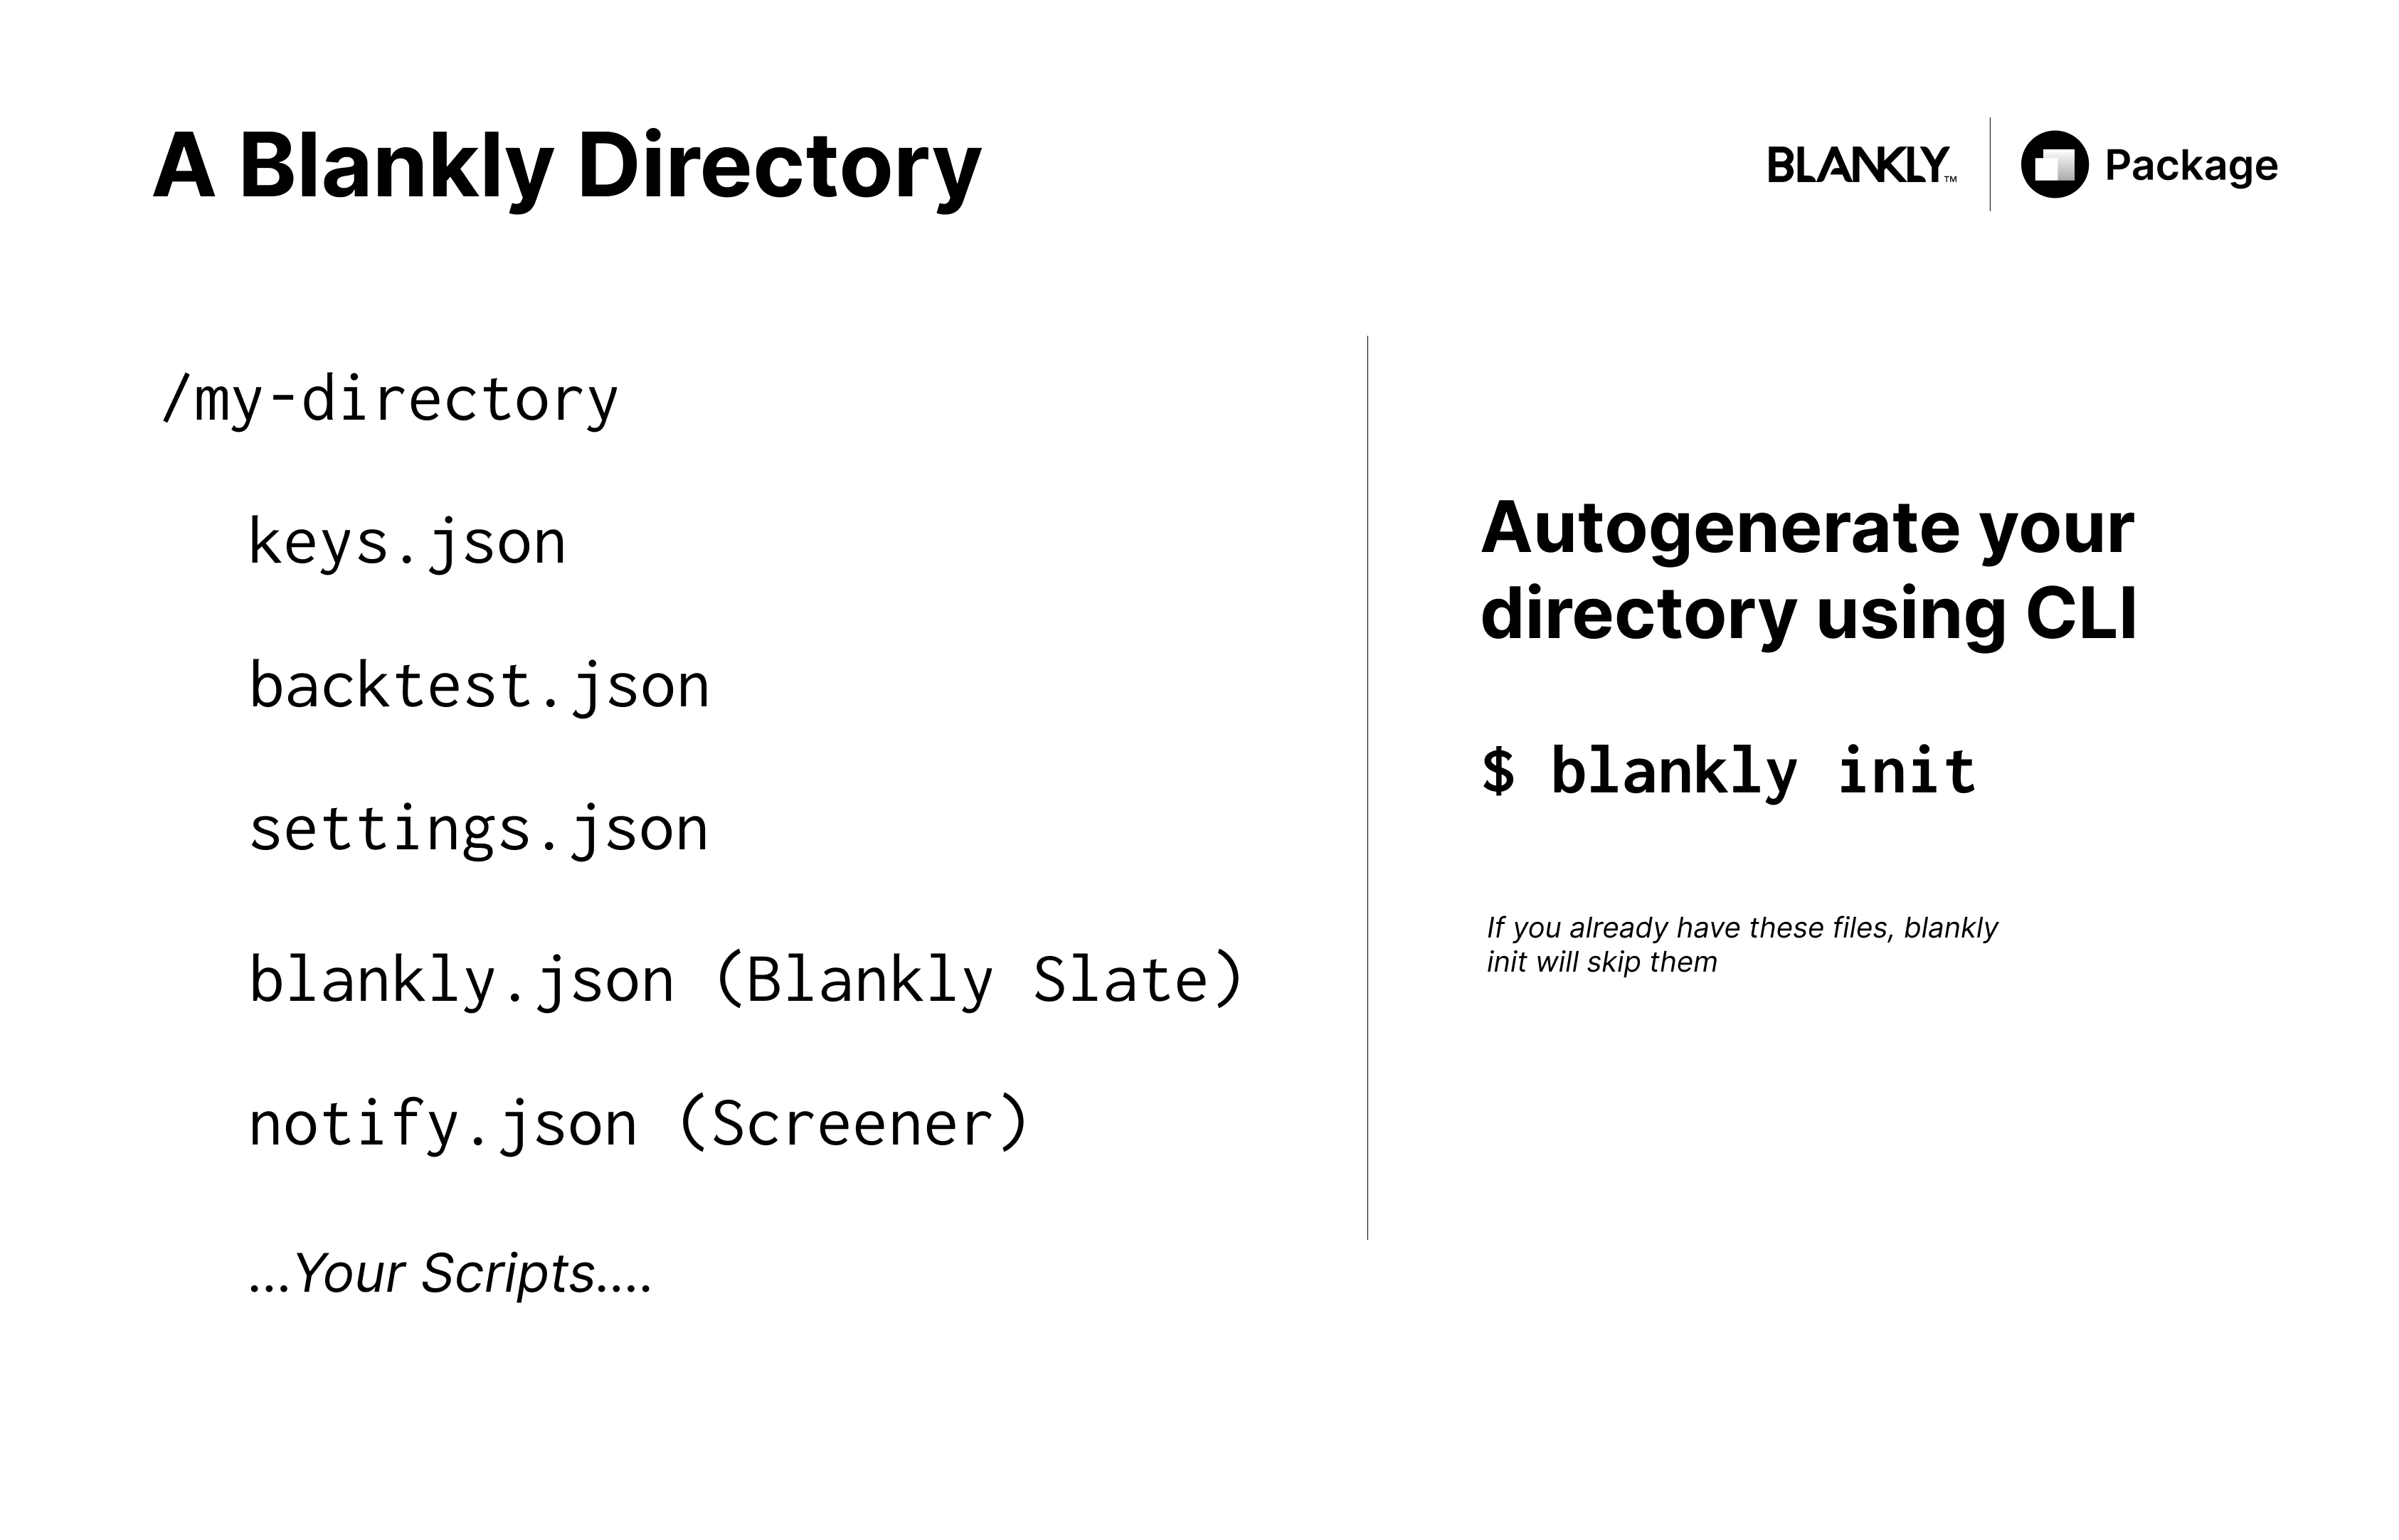
This includes a keys.json that houses all of your keys across exchanges, a backtest.json that allows you to configure backtest details including benchmarks etc., a settings.json for various settings (such as backtest on close, enabling shorting, etc.) and a blankly.json that communicates with Blankly Slate. And of course you have your script the bot.py which is a templated RSI model.
Diving into the Code
To get started, we’re going to go into the [bot.py](http://bot.py) and replace the code with this initial boilerplate
from blankly import Strategy, StrategyState, Interface, trunc
from blankly import CoinbasePro
from blankly.indicators import macd

def init(symbol, state: StrategyState):
    # run on a new price event to initialize variables
    pass

def price_event(price, symbol, state: StrategyState):
    # we'll come back to this soon
    pass

cbpro = CoinbasePro()
s = Strategy(cbpro)
s.add_price_event(price_event, 'BTC-USD', resolution='30m', init=init)
s.start()
As you can see here, blankly divides up a Strategy into a price event, an initialization function, and an exchange. This allows you to add as many price events as you like at varying resolutions.
Our price_event will house our main trading logic while our init will house all the logic required to set items up including our variables, previous history, and whether or not we have a position.
The init function
In order to speed things up, we should make one call to get the historical data that we need and append data as new prices come in. We also need to initialize some variabels for the price event.
We can actually easily do this on initialization and make sure the proper data is passed in to the proper price events:
SHORT_PERIOD = 12
LONG_PERIOD = 26
SIGNAL_PERIOD = 9

def init(symbol, state: StrategyState):
    interface: Interface = state.interface
    variables = state.variables
    # initialize the historical data
    variables['history'] = interface.history(symbol, 400,
        resolution,
        return_as='deque')['close']
    variables['has_bought'] = False
Using the init we’re able to gather our historical data and store that into a deque (a fixed size list) so that we don’t go over in memory. We also initialize a variable of whether or not we have a position to false (so we don’t buy when we already have a position).
Now, we can move on to our price_event . You can also see that we initialized three variables in the global namespaces so any function including our price_event can access them.
The Price Event
Our price event as you can see now does the majority of the logic. It’s the one that’s actually going out to calculate the MACD, and determine the signals. First, we’re going to ensure that our history is up to date by appending the new price. Then we’re going to calculate the MACD on top of our history using our SHORT_PERIOD , LONG_PERIOD and SIGNAL_PERIOD . Then we’ll calculate the slope to determine positive and negative (i.e. cross-up or cross-down), and then we’ll go ahead and buy if it’s a cross-up and sell if it’s a cross-down. Notice that we change the has_bought every time. We also use trunc to avoid floating point errors and overflow.
 def price_event(price, symbol, state: StrategyState):
    interface: Interface = state.interface
    # allow the resolution to be any resolution: 15m, 30m, 1d, etc.
    variables = state.variables

    variables['history'].append(price)
    macd_res, macd_signal, macd_histogram = macd(variables['history'],
                                                 short_period=SHORT_PERIOD,
                                                 long_period=LONG_PERIOD,
                                                 signal_period=SIGNAL_PERIOD)

    slope_macd = (macd_res[-1] - macd_res[-5]) / 5  # get the slope of the last 5 MACD_points
    prev_macd = macd_res[-2]
    curr_macd = macd_res[-1]
    curr_signal_macd = macd_signal[-1]

    # We want to make sure this works even if curr_macd does not equal the signal MACD
    is_cross_up = slope_macd > 0 and curr_macd >= curr_signal_macd > prev_macd

    is_cross_down = slope_macd < 0 and curr_macd <= curr_signal_macd < prev_macd
    if is_cross_up and not variables['has_bought']:
        # buy with all available cash
        interface.market_order(symbol, 'buy', trunc(interface.cash/price, 5))
        variables['has_bought'] = True
    elif is_cross_down and variables['has_bought']:
        # sell all of the position
        interface.market_order(symbol, 'sell', trunc(interface.account[symbol].available, 5))
        variables['has_bought'] = False
Putting it All Together
Putting this all together, we get our final result and overall code! Now we used Coinbase Pro in this example, but Blankly also supports OANDA for Forex, Alpaca for Stocks, and many other crypto exchanges including FTX, Binance, and Kucoin as well. Check out some Common Gotchas between switching exchanges.
from blankly import Strategy, StrategyState, Interface, trunc
from blankly import CoinbasePro
from blankly.indicators import macd

SHORT_PERIOD = 12
LONG_PERIOD = 26
SIGNAL_PERIOD = 9

def init(symbol, state: StrategyState):
    interface: Interface = state.interface
    variables = state.variables
    # initialize the historical data
    variables['history'] = interface.history(symbol, 400,
        resolution,
        return_as='deque')['close']
    variables['has_bought'] = False

def price_event(price, symbol, state: StrategyState):
    interface: Interface = state.interface
    # allow the resolution to be any resolution: 15m, 30m, 1d, etc.
    variables = state.variables

    variables['history'].append(price)
    macd_res, macd_signal, macd_histogram = macd(variables['history'],
                                                 short_period=SHORT_PERIOD,
                                                 long_period=LONG_PERIOD,
                                                 signal_period=SIGNAL_PERIOD)

    slope_macd = (macd_res[-1] - macd_res[-5]) / 5  # get the slope of the last 5 MACD_points
    prev_macd = macd_res[-2]
    curr_macd = macd_res[-1]
    curr_signal_macd = macd_signal[-1]

    # We want to make sure this works even if curr_macd does not equal the signal MACD
    is_cross_up = slope_macd > 0 and curr_macd >= curr_signal_macd > prev_macd

    is_cross_down = slope_macd < 0 and curr_macd <= curr_signal_macd < prev_macd
    if is_cross_up and not variables['has_bought']:
        # buy with all available cash
        interface.market_order(symbol, 'buy', trunc(interface.cash/price, 5))
        variables['has_bought'] = True
    elif is_cross_down and variables['has_bought']:
        # sell all of the position
        interface.market_order(symbol, 'sell', trunc(interface.account[symbol].available, 5))
        variables['has_bought'] = False

cbpro = CoinbasePro()
s = Strategy(cbpro)
s.add_price_event(price_event, 'BTC-USD', resolution='1d', init=init)
s.backtest('1y', initial_values={'USD': 10000})
Looking at the Results
Terminal Results
As we can see, we get these results from the terminal and a nice graph if you did it locally:
Calmar Ratio:                      -0.45
Compound Annual Growth Rate (%):   -34.0%
Conditional Value-at-Risk:         43.3
Cumulative Returns (%):            -34.0%
Max Drawdown (%):                  43.0%
Resampled Time:                    86400.0
Risk Free Return Rate:             0.0
Sharpe Ratio:                      -0.45
Sortino Ratio:                     -0.53
Value-at-Risk:                     456.56
Variance (%):                      18.1%
Volatility:                        0.43
Platform Results
And looking at the platform, we get a wealth of more data that you can see here:
Conclusion
This was a Crypto MACD Bot. Some next steps would be to look at using the Kelly Criterion to optimize your cash allocation towards this specific algorithm. You can also try experimenting with various periods to improve your odds and attempt to run this on multiple price events!
Some major limitations of MACD, however, is that the signals (depending on your time frame) are far and few between and typically aren’t indicative of how strong a trend is. You also need to consider things such as stop losses and when to take profit! There's also the issue with fees! The shorter your time interval, the more you will battle with intervals.
If you’re interested, the link to the actual model in the platform is found here.
If you're interested in learning more, talk to us here @ Blankly and check out our open source package. We'd love to chat! We're constantly in our Discord too!